Two PV systems
We analysed the behaviour of 15 and 50 kWp systems alongside the winery’s loads.

A winery, two PV systems and an anomaly to assess alongside production energy use.
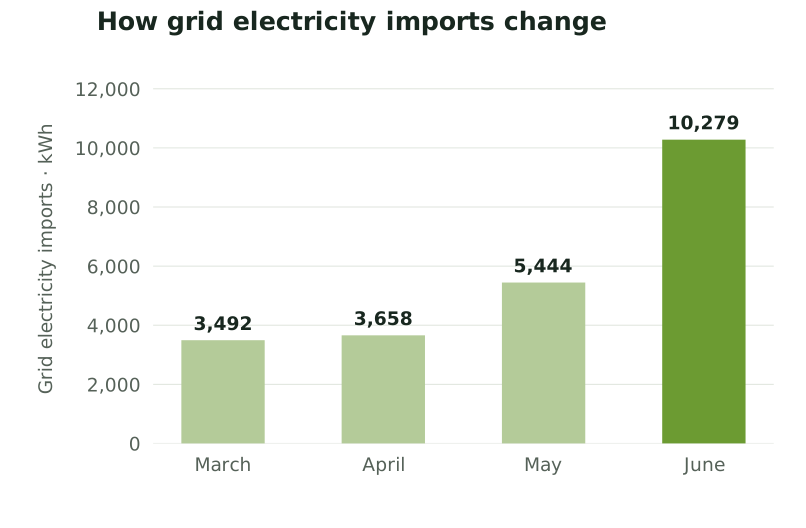
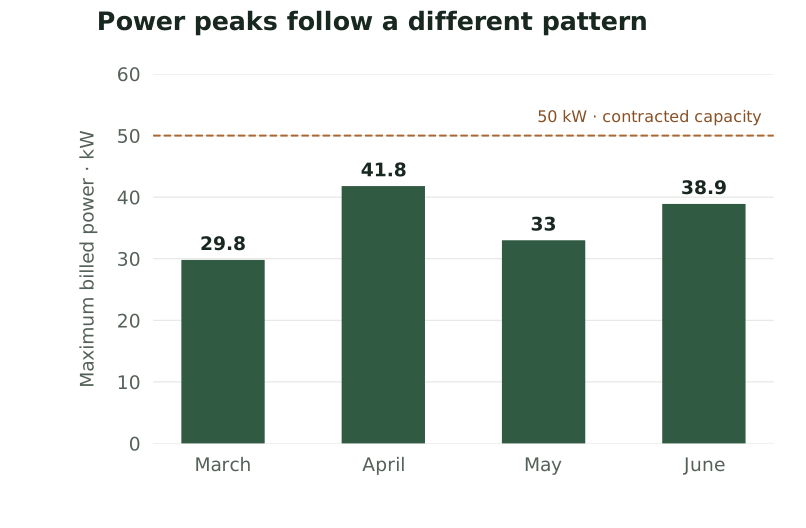
Consumption rises towards summer, while the highest peak in these four months occurs in April. This is why we analyse energy and power demand together.
| Month | Imports (kWh) | Billed maximum (kW) |
|---|---|---|
| March | 3,492 | 29.8 |
| April | 3,658 | 41.8 |
| May | 5,444 | 33.0 |
| June | 10,279 | 38.9 |
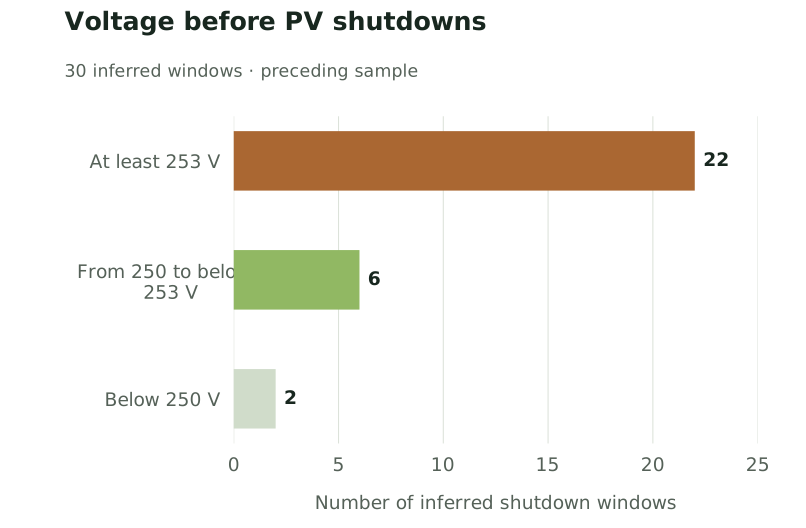
Shutdown windows: 22 preceded by V max ≥253 V; 6 with 250≤V max<253 V; 2 with V max<250 V. Total: 30.
Source: NOAH technical report, revision 1 dated 21 July 2026, sections 4 and 5. Monitoring from 15 May to 21 July; main quantitative data from 27 May after meter corrections. Shutdowns inferred from samples roughly 5 minutes apart. Internal measurements are not equivalent to a certified network assessment.
PV shutdowns were occurring when the business needed energy. We tackled the problem by combining solar production, machinery demand and voltage trends.
We analysed the behaviour of 15 and 50 kWp systems alongside the winery’s loads.
We compared power curves, phase voltages and PV shutdown reports.
We followed controlled load changes to observe how imports, exports and voltages responded.
We examined monitoring data, reconstructed shutdown windows and cross-checked events against recorded voltages. The comparison also covered production loads and the power factor correction unit. We prepared a technical report and supported discussions with the supplier and distribution network operator to investigate voltage quality further.
During the period analysed in the report, we identified 30 shutdown windows for the 50 kWp system; 22 were preceded by a measured maximum voltage of 253 V or above. The correlation gave the investigation a practical direction. A check at the delivery point was still needed to distinguish the network’s responsibility from that of the installation.
The client received a documented reconstruction of events and a technical basis for discussions with the parties involved. This case illustrates analysis and support: a lasting resolution of the anomaly requires the results of dedicated investigations.
Share your goals and available data: together we will identify a useful first step.